
ROI CALCULATOR
Prove the Economics on Your Shelves
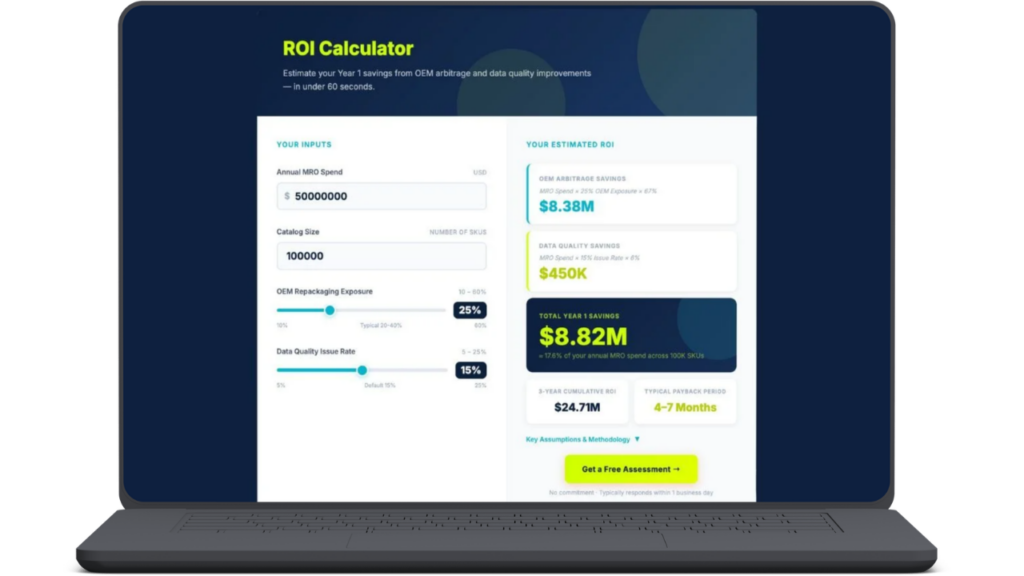
By implementing the ARIVA, organizations transform routine counting requirements into a continuous engine for cleaner data and fewer duplicate purchases driving a 1448% ROI, a 1-month payback period, and a $12.5M annual recurring run-rate by year three.
| Value Driver | Annual Value |
|---|---|
|
MRO spend reduction |
$8.0M |
|
Inventory carrying cost savings |
$720K |
|
Procurement labor productivity |
$319K |
|
Audit & compliance cost reduction |
$1.1M |
|
Trade compliance / COO value |
$800K |
|
Maverick spend capture |
$800K |
|
Emergency premium avoidance |
$800K |
|
Total annual recurring value |
$12.5M |
|
+ One-time working capital release (Yr 1) |
$3.0M |
Discover how leading asset-intensive enterprises use ARIVA to transform stagnant storerooms into optimized, data-driven assets. These real-world deployments demonstrate how continuous inventory intelligence slashes carrying costs and drives rapid payback across diverse multi-site operations.
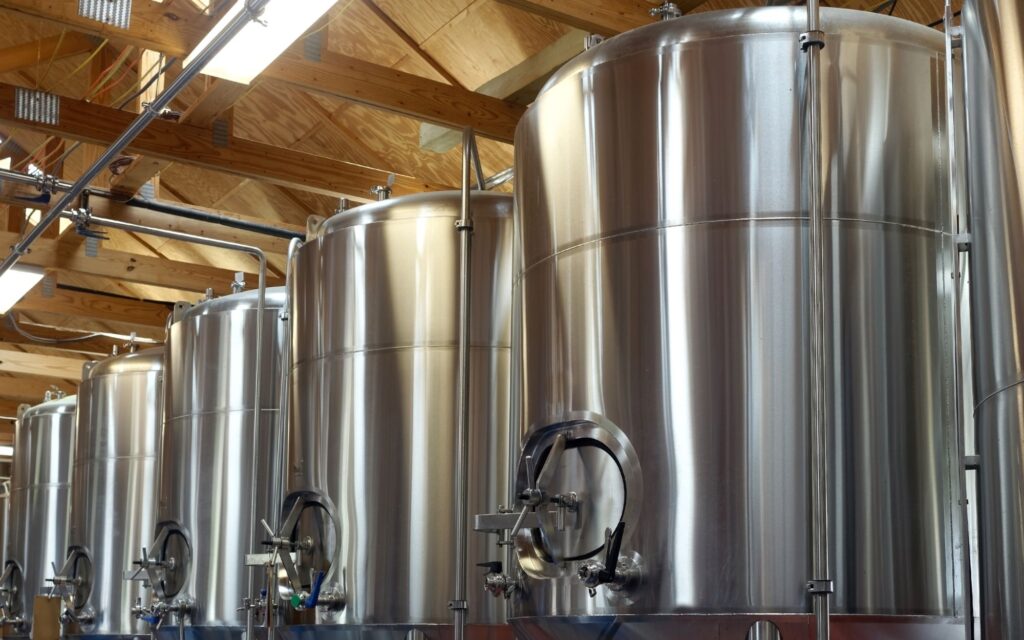

We deployed onsite specialists and ARIVA across a nationwide footprint, the partnership overcame legacy data gaps, unorganized bins, and missing data in regional midstream facilities. The initiative uncovered 11,539 unrecorded items and enriched enterprise data to establish complete master data visibility and operational control.
Frequently Asked Questions
How is the ROI number calculated?
It's based on your catalog size, annual MRO spend, and estimated OEM repackaging exposure, run through the same opportunity-range model used in ARIVA's evaluation deck.
What do I need to run it?
Just your approximate SKU count and annual MRO spend. No integration or system access is required to get an estimate.
How do I use these numbers?
Treat them as a starting business case, not a final quote. They're built for sharing internally, most people take the results straight to whoever owns the budget decision, whether that's a plant manager, a VP of supply chain, or a CFO, as a first-pass justification before a deeper evaluation.
Is this a guaranteed number or an estimate?